Working your way through pesky issue(s) in Prometheus and Thanos
A war story describing how a restart wreaked havoc on an observability stack running on Prometheus and Thanos

Nidhi Sharma
Cloud Engineer
Why at times I question my life choices
As an IT consultant or an external cloud engineer one often ends up working on systems that have been handed down by employees who no longer work at the company. Even with proper documentation, the intricacies and quirks of the system are no longer known to the current members of the responsible team. Now you, as the new so-called expert (read: on-demand garbage collector), need to understand them, then carefully go around tweaking the configurations and hopefully with some luck - fix nasty issues!
Troubleshooting issues in such a system, even if you know the technology or framework, can be tricky because each system can be configured in a myriad of ways. One such example is running a central observability stack in the cloud for monitoring cross-account applications using Prometheus and Thanos. This is a story of troubleshooting and fixing an issue that I sincerely hope you don’t have to deal with.
Before I start describing how things went wrong, let me present to you the AWS Fargate setup that is the scene of our drama.
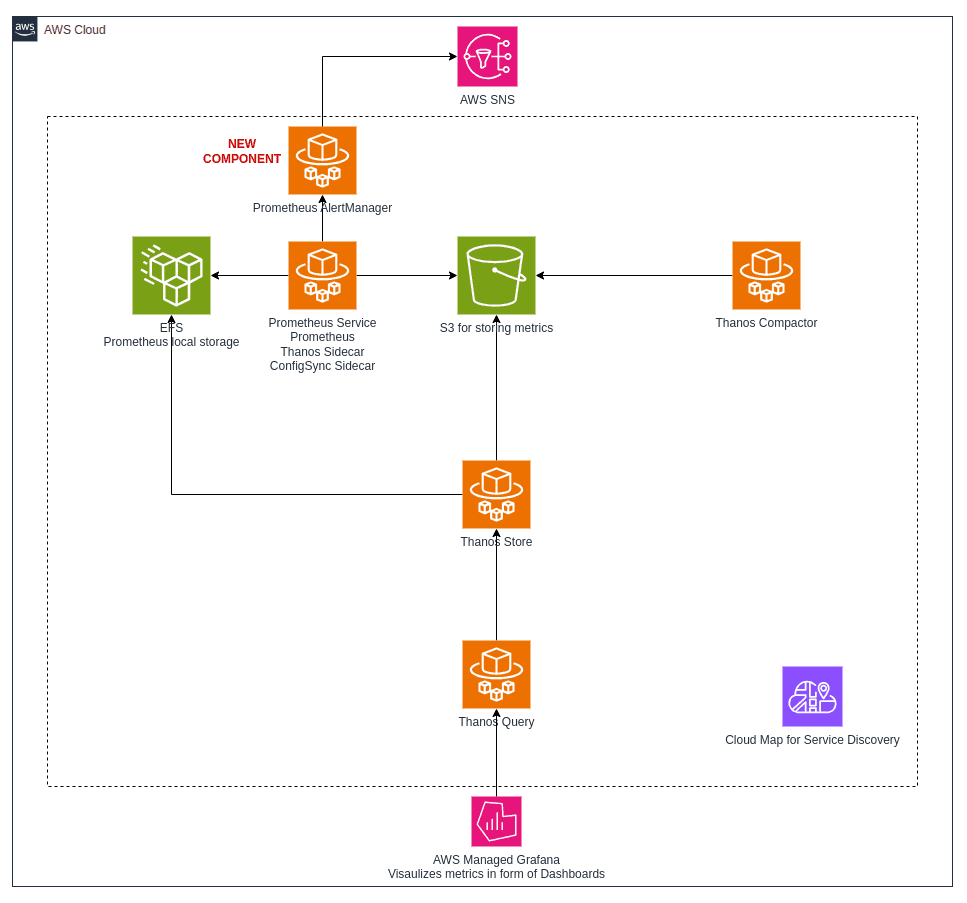
A Prometheus Service runs with 2 sidecars and 1 main Prometheus container:
A Thanos sidecar for shipping data from Prometheus’ local storage to remote storage - S3
A Prometheus configuration synchronization sidecar that reloads the configuration file at a regular interval. The configuration synchronization sidecar ensures that the Prometheus task is not restarted each time the configuration is updated. Note that this Service has not been restarted for a good 8 months!
There are other side components running as Fargate Services in the system:
Thanos Compactor for compacting metrics stored in S3.
Thanos Query used for querying Prometheus local storage (EFS) and S3.
Thanos Store - an internal API used for communication by Thanos.
Grafana calls the Thanos Query endpoint to visualize metrics.
We are in the process of adding a new component - Prometheus AlertManager for managing notifications.
This is a high-level architecture diagram of the setup running on AWS Fargate:

Simple, basic, good enough?
No.
Let’s see how a simple setup can turn into a monstrosity due to misconfigurations over time by various actors. Of course, no one in particular is to blame, but as the system goes through different skilled hands it can unintentionally become a monster.
So, it all began on a pleasant evening when I thought restarting the Prometheus service in the development environment would be harmless. To my shock (though probably not yours), Thanos starts receiving overlapping data blocks - basically the same set of metrics with the same labels and values for the exact same time frame or overlapping time frames.
Found overlap or error during sync, cannot upload compacted block, details: shipping compacted block xxxxxxxxxxxx is blocked; overlap spotted
An educated guess
My first thought is that maybe during the service restart, 2 containers are scraping the same target and somehow ending up with overlapping data blocks. Eventually, it turns out, this isn't the case.
Google, my buddy
A simple Google search of the error reveals that people have faced similar issues but no one has a proper solution or a definite root cause analysis. Along the way, I see some long standing unresolved Stackoverflow questions mentioning similar issues.
Serious examination
Next I start looking for issues on the Thanos Github page. As an engineer, you already know that if you are looking at the Github page for open/closed issues, it is going to be a long night reading discussions, excluding symptoms that are not similar to your system, ignoring trolls and praying that the issue is a known bug that is fixed in a new version of the software. Unfortunately, no such luck for me. At this point, I am also worrying because I can see that metrics worth a couple of hours have not been written to S3 because, once Thanos finds one block it cannot upload, it fails to ship the subsequent data blocks as well!
Rambling continues
Now I switch to the official Thanos documentation and find the issue to be the very first common known issue with 5 possible explanations. Of course, NONE of them apply to our setup!
Realigning priorities
Now I am thinking, Google didn’t help, Github Issues didn’t help, the official documentation has left me on my own. At least let's fix what is broken so that the Thanos sidecar can continue shipping metrics to S3.
To my amusement, the only real solution is to remove the duplicate data blocks (ULIDs) from S3… wait for it… manually. I am like, if it is the first known common issue, why don't we have a tool that identifies duplicates and marks them for deletion?
So, I cook up a quick and dirty Lambda to delete the duplicates from S3 and assign it a temporary execution role. Once the files are deleted, I delete the Lambda and execution role (because I definitely will forget to clean it up later on and untagged objects will raise a security incident on my username).
Restlessness should be followed by periods of rest
It is already late at night, at 3:00 AM, the other realm - the portal to another dimension is opening and my ancestors' spirits are telling me to sleep. It is only the dev environment - Thanos is pushing the data blocks to S3 once more. You will figure out the root cause tomorrow (or not), maybe it is a once in a lifetime error.
Probably, your stars will align better tomorrow.
Low-key detective mode on
A few days later, I start working on other issues and stories and this time the issue occurs on production!
While re-reading the Thanos official documentation I come across a sneaky comment:
“Determine what you misconfigured”.
I roll up my sleeves and start re-reading our configurations for the nth time. With time passing by, my curiosity is turning into furiosity.
Hypothesis
While looking at the flags set up on the Thanos sidecar, I come across a flag called --shipper.upload-compacted
https://thanos.io/tip/components/sidecar.md/#upload-compacted-blocks

Now, when you read this section, you think if I need to retain historical data that was compacted by Prometheus, I should use this flag, fair enough. Then I scroll down and find the flag definition.

Now I’m wondering why it says “use once and then disable when done”. Is this more like a one time migration flag and not meant to be left on permanently?
Wait, something doesn’t make sense or does it?
Now the thing is, if this flag is really sending overlapping data blocks then why did no one discover this issue earlier? The system has been running smoothly for 8 months after all.
Then I find out somewhere in the documentation that when you add this flag, the older existing blocks in the Prometheus local storage are shipped to the remote storage on STARTUP!
Ah-ha! It has been running smoothly without a restart for 8 months, and it was restarted only recently (when my stars didn’t align properly). This explains why no one ever noticed this issue until now!
Oh yeah!
Now, remove this darn flag, redeploy the containers and dance with joy that your system is functioning properly.
Not so fast, this is life, it will suck some more
The new restart caused many more issues in the system due to some other misconfigurations and even now there are outstanding issues. For the time being, I will keep those horror stories to myself 😉
Although restarting a system is a very common way of fixing issues in IT, now I think twice and pray thrice before restarting anything.